


Thinking Football #0: Maximizing Travis Hunter
A pre-draft pilot for a new football newsletter

Over the last few months, I’ve been formulating an idea for a football-focused newsletter, which I’ve been calling “Thinking Football,” as a place where I could apply the frameworks and ideas I've developed over two years of writing Game Theory. The format I have in mind is a 1000-2000 word “cover story” that looks at a timely topic through an analytical lens followed by a section highlighting news and research that inform how I watch the game. I also wanted to try my hand at doing the artwork myself, and you can see my first attempt below. I’m planning to do another issue - the post-draft edition - in a couple of weeks, and based on how these first two go, potentially running an issue once a week through football season. Let me know what you think, and if you enjoy it, make sure to share with a friend. As always, thank you for reading.
Maximizing Travis Hunter
Tonight, when Travis Hunter is selected in the 2025 NFL draft, the question around how best to utilize him will get more complicated and less interesting.
Last season, Hunter won the Heisman (best player in college football), Nagurski (best defensive back), and Biletnikoff (best wide receiver) awards, while playing 92.8% and 94.4% of possible snaps on offense and defense, respectively (about twice as much as anyone else). Hunter is the best two-way prospect in NFL history, with the potential and durability to be both an elite wide receiver and elite cornerback - something the league has never seen before.
It’s his one-of-a-kind potential which makes it a shame that Hunter’s NFL usage will in part be a reflection of the needs of his new team. Rather than the unique blend of abilities that allowed Hunter to thrive both ways in college, Hunter’s opportunities on either side of the ball will be a function of many little, non-Hunter factors - the strength of Hunter’s fellow WRs and CBs, the competence of his coaches, and the opinions of management, among others. Questions like “How should the Browns use Travis Hunter?” or “How should the Giants use Travis Hunter?” yield answers that say a lot about the particulars of the Browns and Giants, and less about the potential of Travis Hunter.
So before we know where Hunter ends up tonight, let's ask a question free of all those messy, non-Hunter factors: On a neutral team, how many snaps should Hunter play on either side of the ball to maximize his season-long impact?
The Formula
Broadly, we want to model Hunter’s season-long impact like this:
Season Value = Per-game value * (Total Games - Games missed for Injury)
We’re trying to maximize the value that Hunter produces across an entire season by picking the optimal number of snaps for him to play on both sides of the ball. What this equation captures is the natural tension that comes with increasing Hunter’s snap count: the more snaps Hunter plays in any one game, the more of an impact he can make, but the more likely he is to suffer an injury, causing him to miss games entirely. The optimal number of snaps that Hunter plays at WR and CB will balance his impact in any one game with the injury risk that playing extra snaps incurs.
But to arrive at an optimal solution, we need to solve for the two unknowns in this equation: How Hunter’s snap counts at WR and CB affect his value each game, and how they increase his risk of injury.
Modeling Games Missed
The injury data our model relies on comes from a 2016 analysis by Michael Gertz at ProFootballLogic. Gertz analyzed every snap in the 2015 season to find not only the average injury rate, but also the average length in games of each injury, for each position.
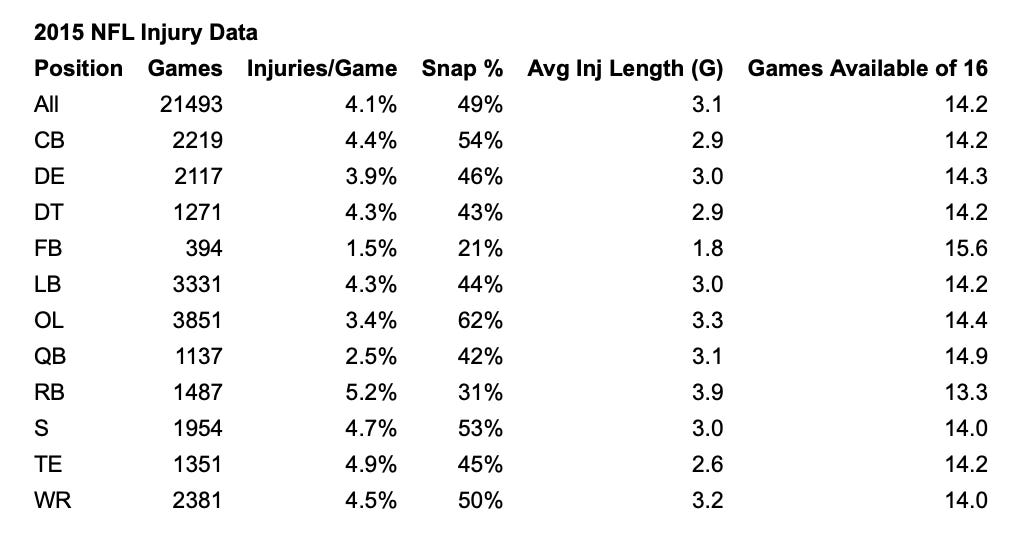
Gertz found that wide receivers were slightly more injury-prone than cornerbacks (4.5% and 4.4% injury rates, respectively) and missed a bit more time per injury (3.2 vs 2.9 games) - perhaps reflective of wide receivers' role as the player being hit, rather than the one hitting. But given the relative low frequency and high variance of injuries, and in the interest of keeping the model a little simpler, we’ll model Hunter’s injury risk and the average length of those injuries as the average of the WR and CB rates and lengths.
We now face the question of how to convert these per-game injury rates to a per-snap basis, which we’ll need given that Hunter could play up to twice as many snaps as an average full-time player. The simplest option would be to create a linear relationship between snap count and injury rate, which would mean dividing the injury rates Gertz found by the average number of snaps played by WRs and CBs per game, and then multiplying that by the number of snaps Hunter will play. But I think this might result in slightly over-simplifying and under-estimating Hunter’s injury risk, because it fails to capture a key injury factor: fatigue. While every additional play presents an additional opportunity for some injury-causing collision, what I see as the more likely injury concern for Hunter is the fatigue he’ll accumulate throughout the course of a 120 or 130-snap game, making all injuries, but particularly non-contact ones, more likely.
To consider fatigue, we can model the relationship between total snaps and Hunter’s injury risk as an exponential function, rather than a linear one. What this effectively says is that because Hunter will be more likely to be injured as he fatigues, every additional snap that Hunter plays is riskier than the previous one, and snaps at the end of the game will be much riskier than the ones at the beginning - a behavior I think captures the true challenge of playing huge snap counts better than assuming each snap is equally likely to cause injury.
In this injury model, the increase in injury risk for each additional snap (the steepness of the exponential curve) is determined by a constant, which we’ll call Hunter’s fatigue factor. Even small changes in the fatigue factor result in large increases in risk at high snap counts, and can quickly balloon Hunter’s expected games missed to untenable levels. For example, Hunter’s expected games missed at 160% of usual full-time snaps (roughly 104) at a fatigue factor of .05 is 9 games. As a full two way player (130 snaps), Hunter’s expected games missed comes out to a frightening (and impossible) 34.5.

In many ways, the entire exercise of maximizing Hunter’s season-long value lies in the true value of the fatigue factor. If it’s sufficiently low, you can play him many more snaps. Too high, and he’ll spend a big chunk of the season injured and not accruing any value at all. It’s worth noting that while we have to (very imprecisely) estimate the fatigue factor, Hunter’s future employer might be able to actually get a much truer curve by observing Hunter in games and practices. Some combination of V02 max and lactic threshold testing might reveal Hunter’s fatigue threshold, which they could then use to calculate true fatigue and, in turn, a more accurate model for expected games played as a function of snaps.
Measuring Value
With the injury function in place, we now need a way to estimate Hunter’s value per-game at WR and CB, so that we can multiply it by his expected games, and arrive at his season-long expected value.
The best metric across the NFL analytics universe for valuing players across positions is NFL Plus/Minus, from
’s excellent Substack, Unexpected Points. It’s worth reading the methodology behind how Cole derives Plus/Minus here, but for our purposes, we can focus on how to interpret its outputs: “expected points added over replacement player.” What Plus/Minus measures is the contribution of every player on the field in points they add to their team compared to what a league average alternative would add. For example, if WR Justin Jefferson generates 30 Plus/Minus across an NFL season, he produces 30 more points for his team than an average backup, or around 1.76 points per game if he plays a full season. For some context, here are some top WR and CB seasons over the past five seasons: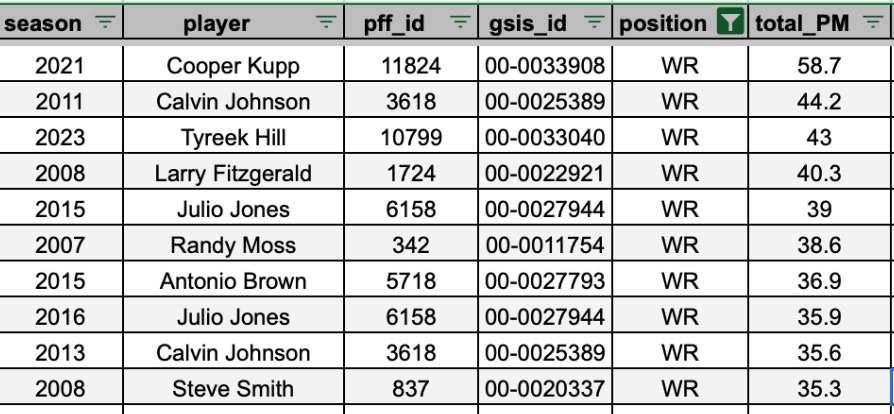

We’ll incorporate Plus/Minus to estimate different levels of skill for Hunter at WR or CB in the NFL. By leveraging Cole’s historical Plus/Minus data, I found the average per-game output of the 50th (league-average), 75th, 90th, 95th, and 99th percentile CBs and WRs.
This range of contributions lets us address a key consideration for optimizing Hunter’s value - his optimal snap distribution depends on how good he is at each position, and we have no idea how good Hunter will be at WR or CB in the NFL. Using these tiered values, however, allows us to represent a range of outcomes and see how Hunter’s optimal snap count changes for each combination.
One takeaway from this exercise is seeing the impact of CBs and WRs at different levels of quality. Good CBs, those between the 50th and 90th percentiles, yield more value per season than good WRs. But once we go over the 90th percentile, into the “elite” territory, WRs actually have much higher ceilings than their elite CB counterparts. The 99th percentile WR adds 1.97 Plus/Minus per game, where the 99th percentile CB adds 1.62.

It’s interesting to try to square this difference at the high-end of players, because in a way, cornerbacks and wide receivers are competing directly for the same EPA each play - either completing or preventing the pass. My guess is that the higher upside for elite receivers compared to cornerback reflects the fundamental advantage of the offense: they get to set the rules of engagement. You can force the ball to an elite WR, but you can’t force the offense to throw the ball towards your elite cornerback. An elite wide receiver generates value by making explosive plays with the ball in his hands. An elite CB creates value by preventing the ball from getting there. The value these two players create is zero-sum when they are matched up one-on-one. But when push comes to shove, the elite wide receiver just goes to the opposite side of the field as your elite cornerback. Yes, the defender forcing the offense away from his side of the field generates value, but perhaps not as much as the elite wide receiver is about to create against your CB2.
Using Plus/Minus as our value metric, our full model looks like this:
Season Impact = [CB_Skill * CB_Snap_% + WR_Skill *WR_Snap_%] * [17 - .001 * e^(f × (WR_Snap_% * 65 + CB_Snap_% * 65)) × 17 × 3.05)]
And with this, we can see how Hunter’s optimal snap distribution changes as his skill at WR and DB changes.
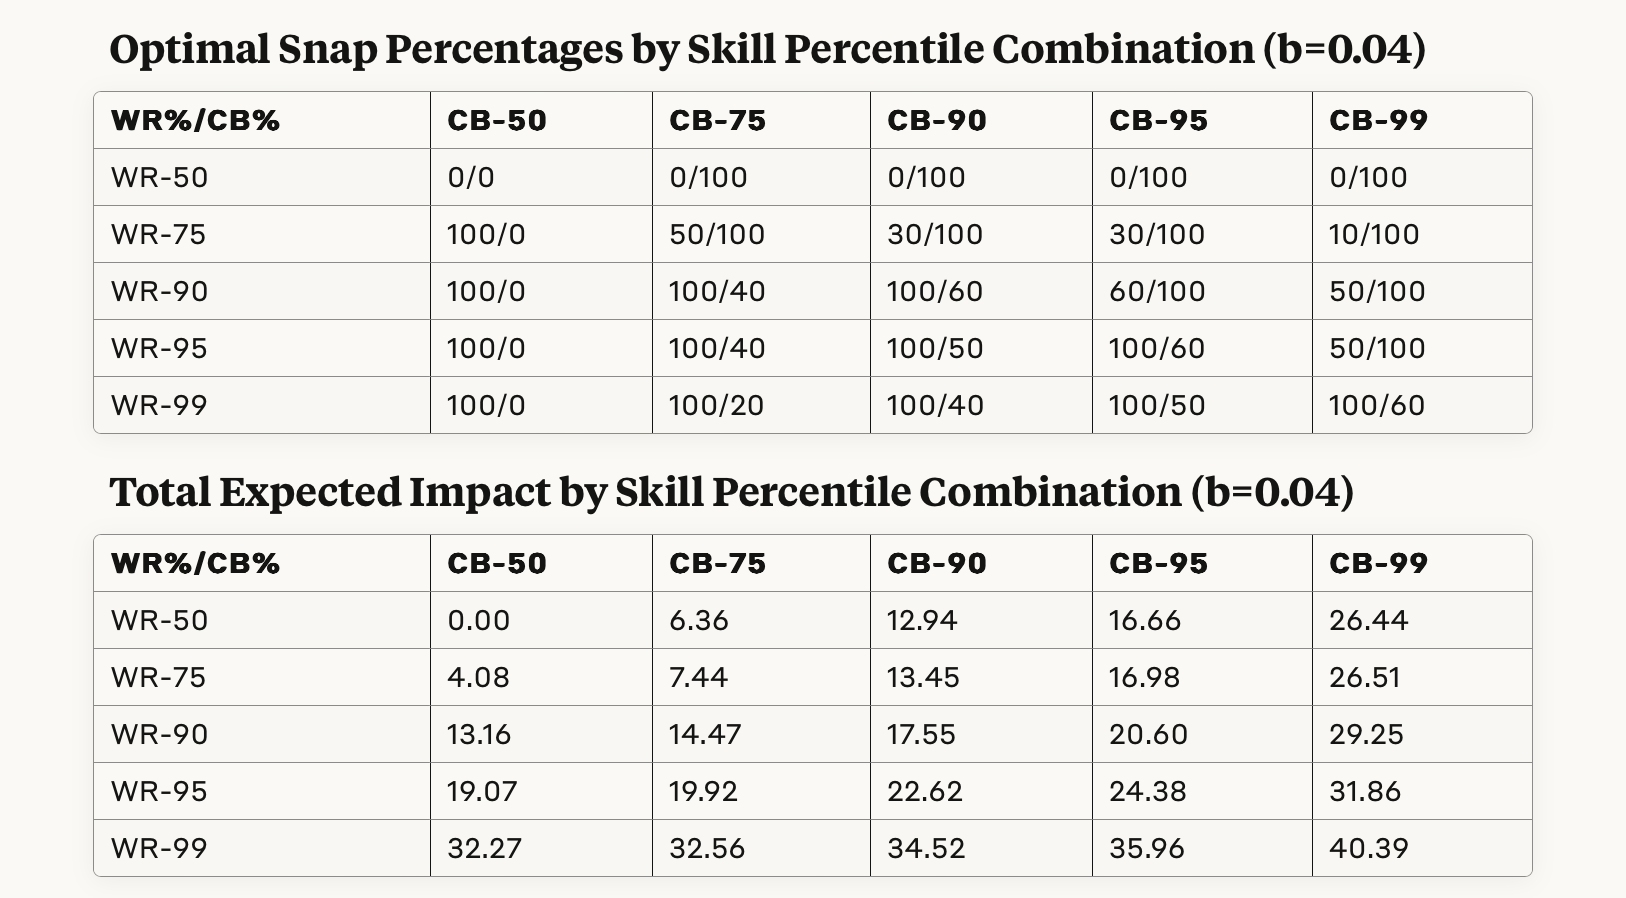
To start, I held Hunter’s injury fatigue factor constant at .04, a level I arrived at because it allowed a wide range of optimal solutions. If Hunter’s true fatigue factor is much higher or lower than this, the model quickly zeroes in on solutions where he plays 100% both ways (low fatigue), or focuses almost exclusively at his better position (high fatigue). The way to interpret these results is with the caveat that they are Hunter’s optimal snap distributions given that Hunter isn’t so injury prone that he faces massive risk over the standard 65ish snaps, but not so durable that we would feel confident he can play many games up at 130.
What jumps off the page is how the Plus/Minus upside of elite WRs tips the solutions towards 100% receiver once Hunter enters the great receiver range (90th percentile or better), even when Hunter is equally good or better at CB. The two exceptions are where Hunter is a 90th or 95th percentile WR and a 99th percentile DB, in which case the model suggests he play 100% of CB snaps and 50% on offense.

The other takeaway is that if Hunter can be a 90th percentile or better option at both WR and CB - a tall order but certainly possible, given he’s being graded as both the #1 WR and #1 CB in this class - and he can stay at least as healthy as the model suggests (it projects between 2 and 3.3 expected games missed for injury in these cases) he’ll be a surefire MVP candidate. Last year’s best WR and best CB by Plus/Minus, Jamar Chase and Pat Surtain, posted 33.8 and 31.2 Plus/Minus respectively, but they also played 17 and 16 games respectively, whereas the injury model expects Hunter to be available for at most 15 games where he is in the 90th percentile for both positions and he plays the value maximizing number of snaps. On a per-game basis, Hunter would be posting between 1.2 and 2.94 Plus/Minus per game, the high-end of which would be the highest impact games ever for a non-QB.
That should be a pretty solid case for whichever team drafts Hunter to at least give him a shot to play both ways. The injury concerns are very real at high snap numbers, but there are lots of ways to stagger Hunter’s snaps, like focusing him on higher leverage plays (3rd downs, red-zone, and 2-minute situations) for his non-primary position. If he can do that and stay healthy, then Hunter has a good shot to be the most impactful non-QB in football, and a perennial MVP candidate.
It’s also worth mentioning what I see as the primary blind spot of this model - the role of development in Hunter reaching his true skill level on both sides of the ball. When asked about Hunter’s potential to play both ways, Ravens head coach John Harbaugh said he didn’t know if there was “enough time in the day,” for Hunter to play both, alluding to the fact that by trying to learn two positions at once in the NFL, Hunter might end up failing to fully realize his potential in either. I think that's a fair point, and certainly a more complete way of thinking about Hunter’s potential impact would consider the cost of spreading himself across both positions on his ability to become elite in either. But on the other hand, it sure didn’t stop him in college.
Quick Picks
Research I’m thinking about as I’m watching the draft tomorrow
What analytical draft value curves are missing about NFL roster building - By
Kevin was the MVP of my Travis Hunter piece above by very graciously letting me use his subscriber-only data in my model, but he does much, much more than just Plus/Minus. His work on using surplus value to approach the draft is the piece I would tell you to read before tonight (so you can tell your friends why the Jaguars made a huge mistake taking Jeanty at 5).
2025 NFL Draft: Miami QB Cam Ward Breakdown - Part 2 - By
Cam Ward is going to be the #1 pick tonight, but is not quite the slam-dunk prospect we’re used to seeing as the first QB off the board. Ward is known for using his physical traits to make big-time throws, but the real determinant of his success in the NFL is going to be the boring stuff, like how he processes the field and makes decisions under pressure. Nick, the best film review guy on the site, dives into Ward’s readiness in those traits, and gives his verdict on whether he’s a deserving #1 pick.
No Team Can Beat the Draft - By
A draft classic. At this point you’re probably feeling like Howie Roseman and the Eagles really do have some kind of evaluation edge in the draft. Yet, as Neil shows us, it’s much more likely that Roseman and the Eagles are just on a heater right now, and this too will (hopefully) pass.
Travis Hunter Draft Profile - By Lance Zierlein
This was just a way of plugging all the Lance Zierlein analysis for the 2025 class. I thought this Hunter one was particularly fun because Zierlein actually seems a little… Low on him? The DeVonta Smith/Darius Slay comps don’t quite have the same “generational talent” that a lot of other analysts are pushing, and the 6.9 prospect score (on the patented 8-point Zierlien scale) is a lot lower than I was expecting.
Sitting behind a legendary QB means learning from the best - By Nick Wagoner
Another old favorite of mine. The sit-and-develop approach has become increasingly popular in recent years, but it’s hard to say what exactly these quarterbacks learn when they are sitting and learning. Wagoner does a great job shedding some light on that process here, and noting how the soft skills that sitting quarterbacks develop translate into success on the field.
Edited Excellently by Greta Gruber
Really enjoyed this! Keep it coming!